Standard monitoring tells you a server is up. We built the part that tells you the business is.
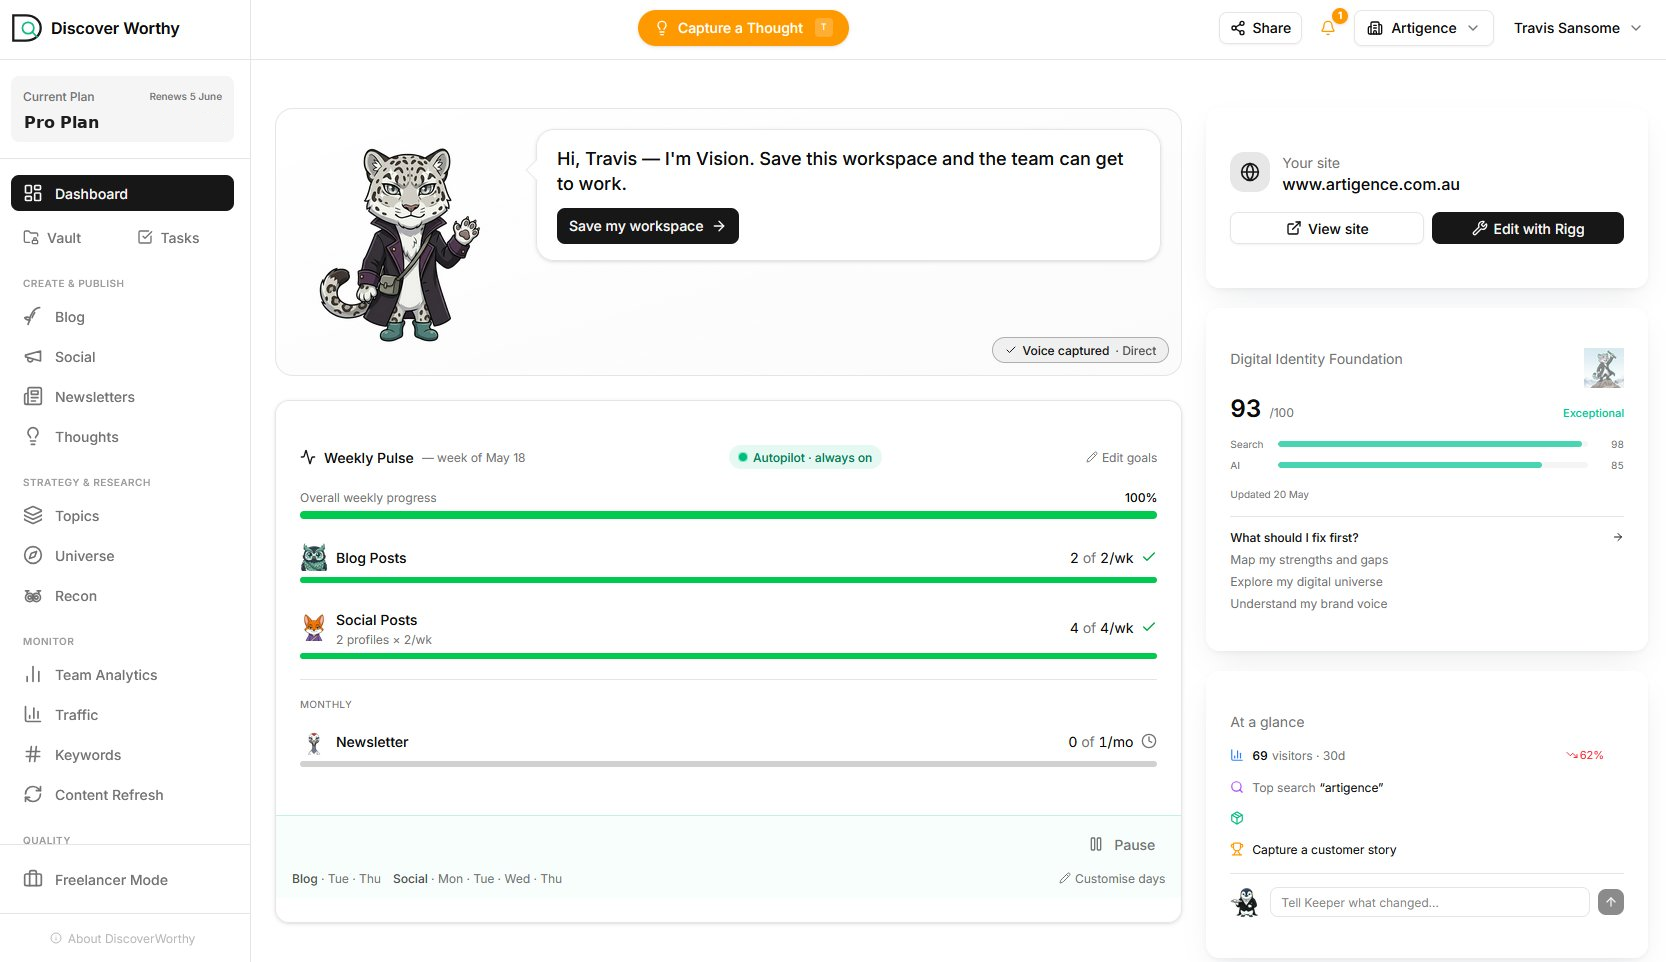
WatchTower sits across the systems your business actually runs on — the order portal, the warehouse stack, the integrations behind them, the cloud bill — and gives you one screen that says which clients are healthy this morning and which need a phone call.
The off-the-shelf bit is checking that a server replies. We built the part where you’ve got many clients on shared infrastructure and you need to know that Brightline’s login test failed at 6am, that Northbridge’s cloud spend jumped overnight, and that both are the same underlying problem — without an engineer reading logs at dawn to work it out.
For a wholesale operator whose day is order flow, that’s the difference between hearing about an outage from your customer and hearing about it from your dashboard.
What we owned
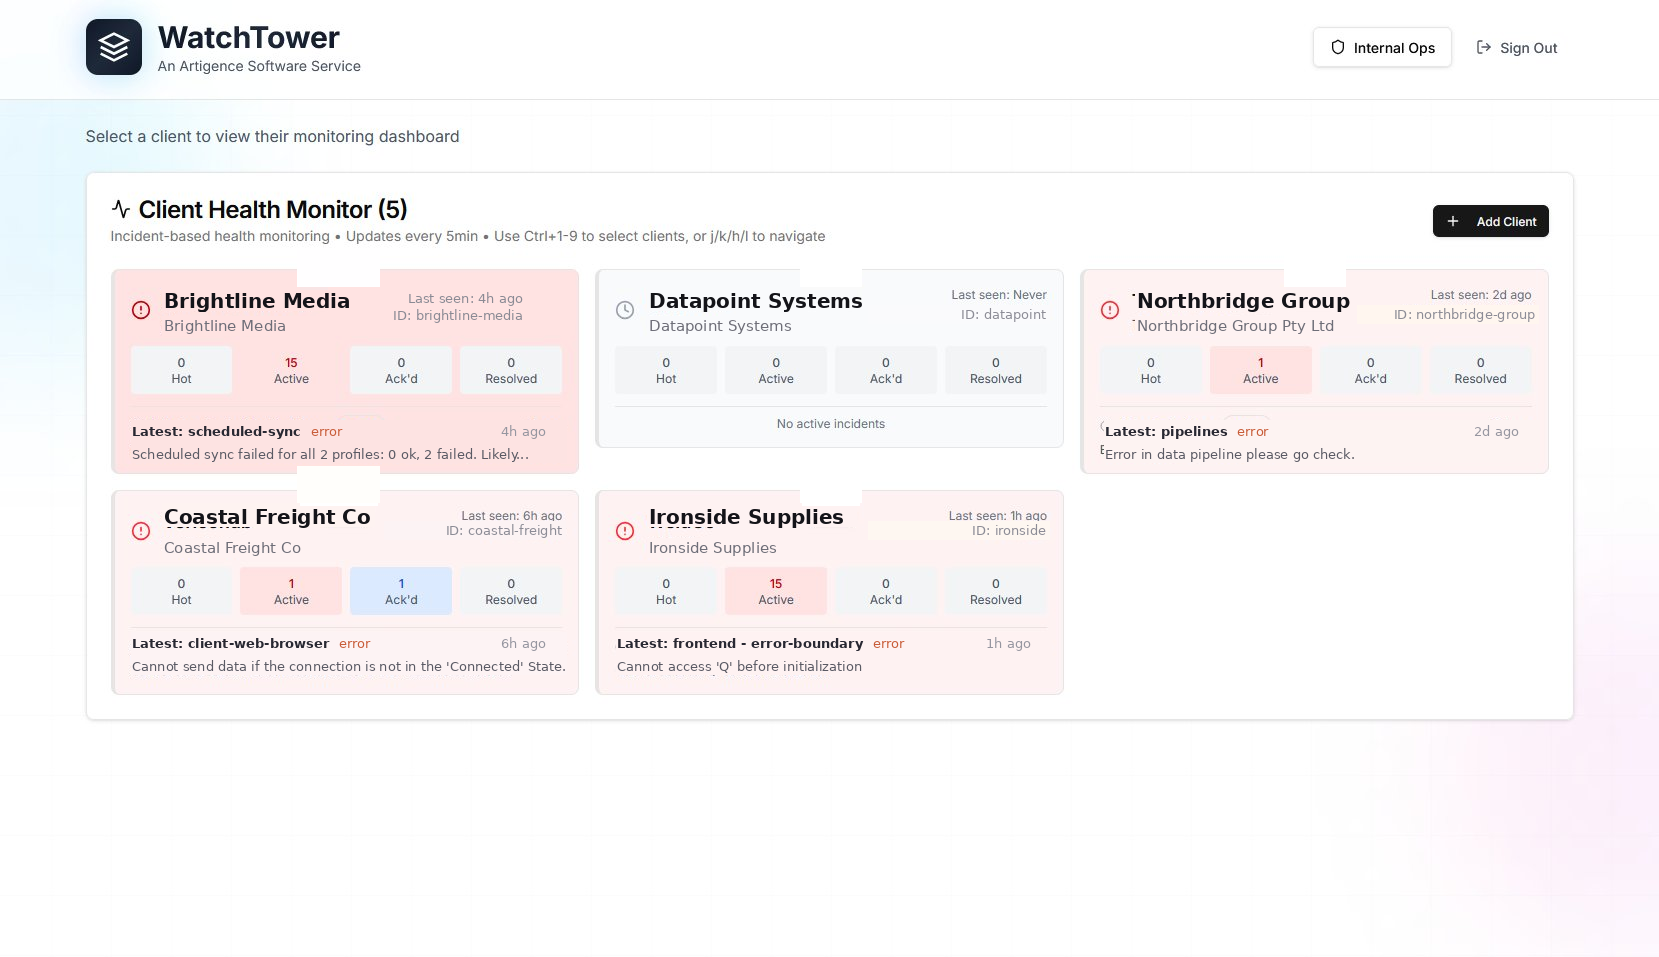
- Per-client health view — one screen, every customer, status at a glance.
- Scheduled login and transaction checks against the actual customer journey, not just server pings.
- Incidents grouped automatically, so one broken thing isn’t fifty alerts.
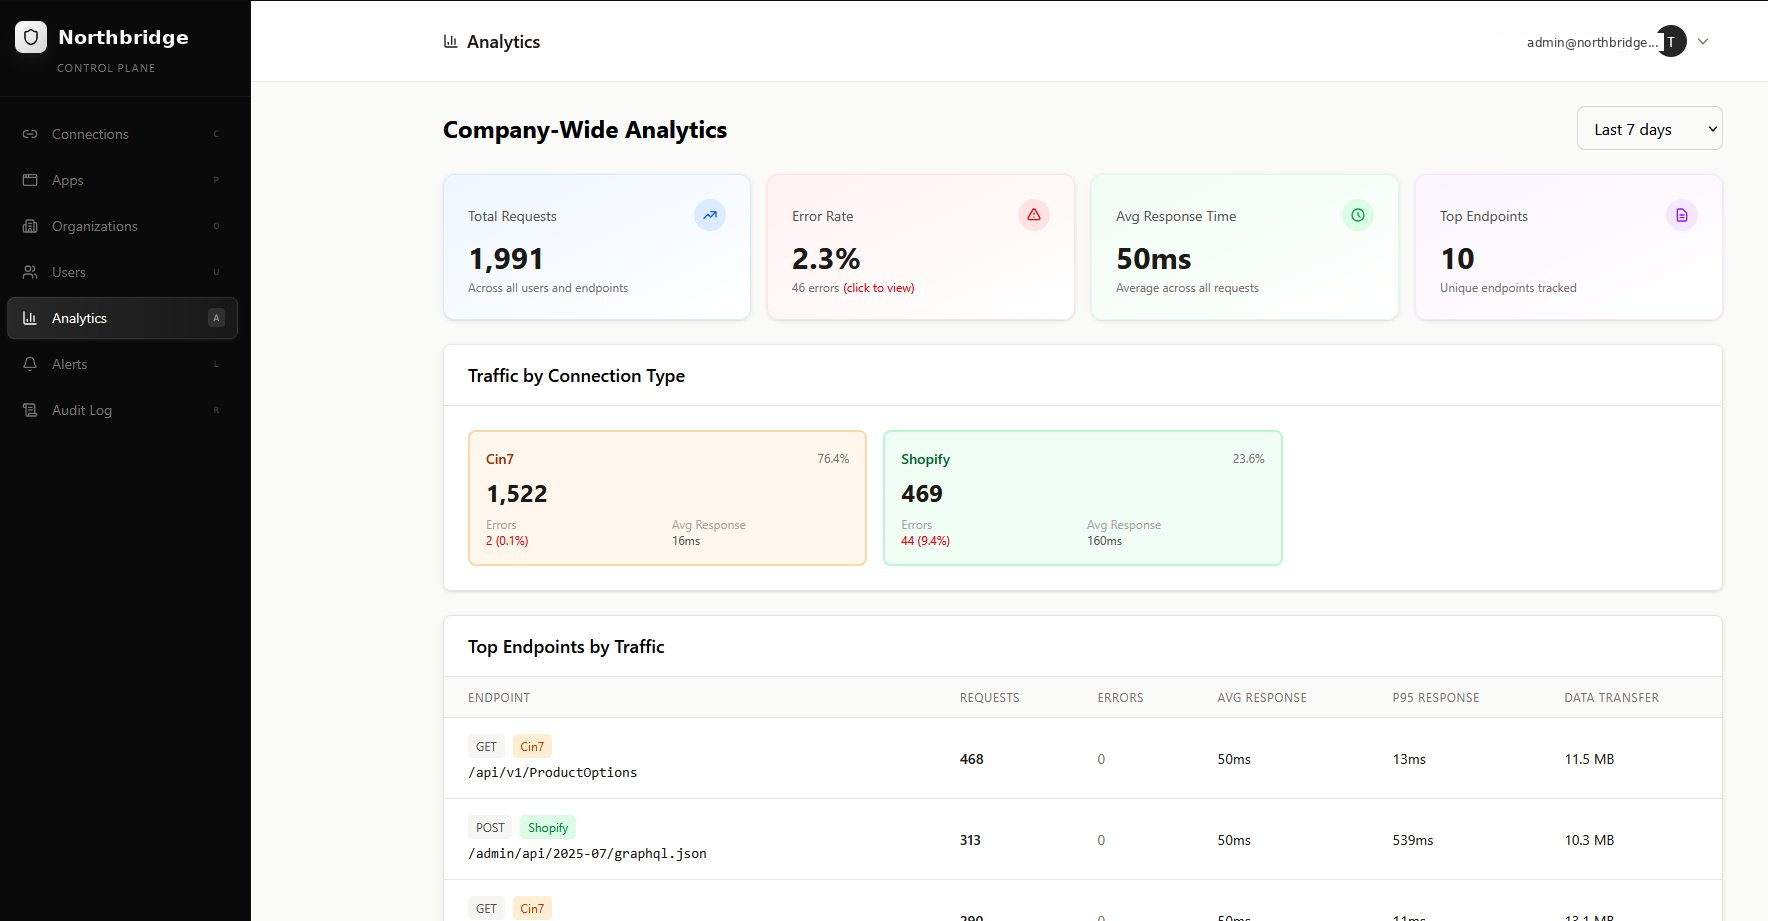
- Cloud cost monitoring built in — a spend spike raises an incident the same way an outage does.
- Claude and ChatGPT can query WatchTower directly, so “what happened at Coastal Freight yesterday?” is a question your ops manager can just ask.
“The dashboard your operations manager checks before their coffee — not the alert that wakes them at 3am.”